
Neural activity data-sonification, with Sébastien Wolf (ENS Institute of Biology).
Data sonification could be an effective tool for neuroscience research, complementing data visualization. Recent advances in brain imaging have made it possible to record the activity of tens of thousands of mammalian neurons simultaneously in real time. The spatial and temporal dynamics of neuron activation can be translated into sound triggering, according to the functional groups to which these neurons belong.
We have developed a software to load such datasets as binary matrices and translate them into MIDI messages, triggering notes whose velocity is a function of neuronal activity. In order to process this vast quantity of data — several tens of thousands of neurons over several tens of thousands of samples — the software enables neurons to be associated in sub-groups, such as those proposed in common atlases, or in an arbitrary manner. The same interface can also be used to sonify continuous data sets from electroencephalography (EEG) recordings of human brain activity.
This software, developed with Max, can be used as a stand-alone program, but can also be loaded directly as a plugin into the Ableton Live digital audio workstation. This makes it easy to get to grips with the software, enabling you to test different mappings between neural activity data and musical values: which chords, which harmonic progressions, which orchestration, etc. translate the neural activity data set in the most interesting way from the point of view of their scientific understanding and/or musical aesthetics.
References
- Vincent Goudard, Sébastien Wolf. The Brain Orchestra, un outil de sonification de l’activité neuronale. Journées d’Informatique Musicale, GRAME; INRIA, Jun 2025, Lyon, France. ⟨hal-05102386v1⟩
Media
Sonification of the zebra-fish neural activity
In the three videos below, you can see and hear the brain’s activity of a larval zebrafish, which has the good idea of being transparent and filmable with suitable microscopes. Its 80,000 neurons communicate by sending small electrical impulses to each other, according to a dynamic and functional organization that neuroscience research strives to decipher.
1. Sonification of the ARTR region
The activity of the region selected here, called the “Anterior Rhombencephalic Turning Region”, is correlated with the zebrafish’s swimming movements, to the left or to the right. The sonification of both hemispheres of this region (in red and blue) according to different tunings suggests the alternation of this activity, depending on the zebrafish’s turns.
2. Sonification of the habenula region
The region selected here is called the “habenula”. It is a small and deeply nested region of the brain, common to all vertebrates animals, that contains a few hundreds neurons in the case of the zebra-fish. The habenula is a central structure that connects forebrain regions to midbrain regions, and acts as a hub or node for the integration of emotional and sensory processing. The activity of this region in that dataset shows asynchronous peaks, where groups of neurons tend to fire spikes in sequences rather than simultaneously. The resulting sonification is hence closer to a monodic melody than to a sequence of harmonic chords.
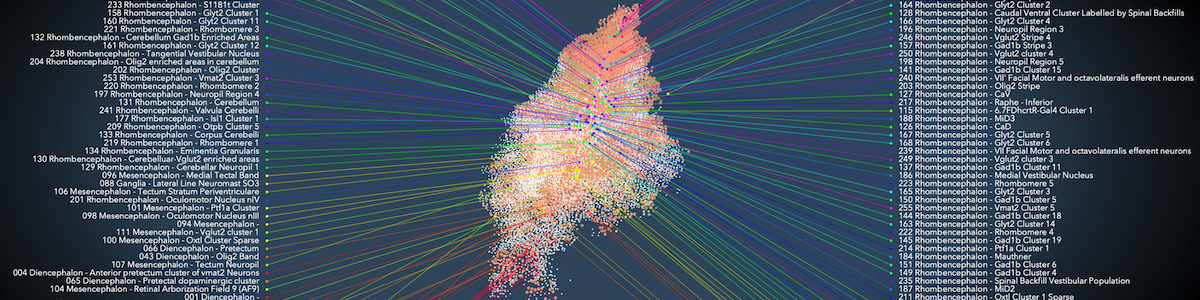
3. Fine grain sonification with granular synthesis
This video shows the neural activity of a zebra fish larvae, whose 23743 neurons have been recorded using light-sheet microscopy. This dataset is then downsampled to 8000 points, then fed to a granular synthesis engine. Grains of sound are triggered according to the activity of this subset of neurons. The pitch of the sound is mapped according to the position of the neurons along the spinal cord axis, and spread on four octaves of a diatonic scale. This mapping allows to highlight the spatial propagation of the neural impulses (also called “spikes”) throughout the brain, resulting in rapid audible glissandi/arpeggi, with occasional “epileptic” clusters of notes. Each grain of sound is then spatialized in a stereo output according to their 3D position.
Sonification of a human brain’s EEG
This example shows the sonification of 16 EEG sensors (out of 64 in the whole dataset) placed on a human skull, while the subject was asked to performed various visual indentification tasks. The sonic result lets one hear various timescales of musical patterns, along with various harmonic combinations (and non-combinations), suggesting the synchrone activity of several regions of the brain, and the asynchrone activity of other regions. Overall, the gradual crescendos and decrescendos of the different EEG channels make for a pleasant cinematique soundtrack. Who would have known this (and more) all happens in your brain?
2 thoughts on “The Brain Orchestra – neural activity sonification”
Comments are closed.